
Turn Pressure Into Performance
SHI diagnoses system stress, predicts risk, and delivers action plans that improve efficiency, profitability, and resilience.
Transform your data into empowering insights with our cutting-edge System Health Index, designed to create a unified health report from multiple sources.
Real-time data synchronization from multiple reports
Harmonizes data into a comprehensive health report
Suitable for business or conservation efforts
With our harmonized health report, feel empowered by gaining meaningful insights that drive successful outcomes and environmental resilience.
What the System Health Index Is and What It Measures
The System Health Index (SHI) is a diagnostic framework that consolidates the raw data organizations already collect - through KPIs, BI systems, and other reporting methods - into a single, holistic view of system health.
SHI provides:
System Pressure Mapping – Identifies where strain is building before it becomes a failure point.
Predictive Insights – Equips organizations with a forward-looking lens to address pressure before costly breakdowns occur.
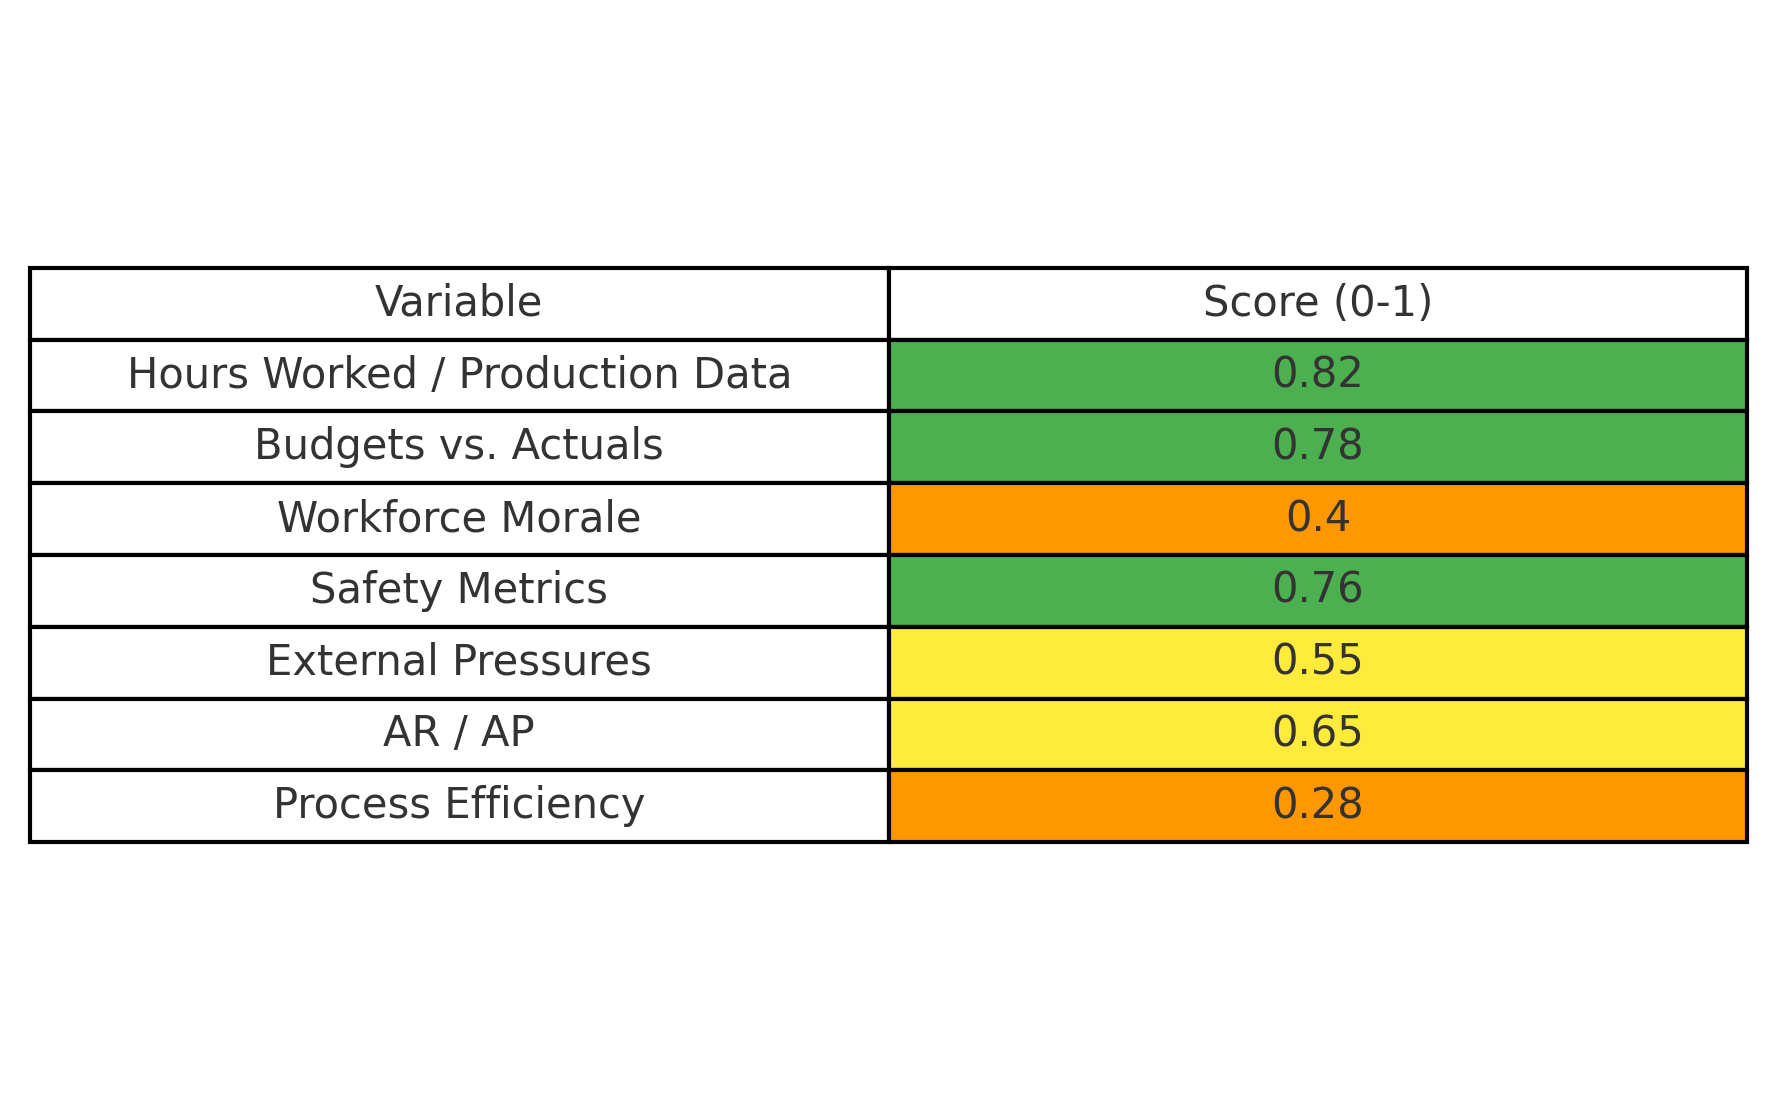
Health Scores – Translates complex data into clear, comparable System Health Scores for each division or variable.
Targeted Diagnostics – Pinpoints the lowest-scoring variables to prioritize corrective action.
Action Plans – Outlines practical steps to reverse downtrends before they escalate into systemic oversights.
Unlike traditional metrics, SHI is designed to be scalable: it can measure the health of a crew, a division, or an entire company. A unique feature of SHI is its ability to measure Command Load - a variable that indicates whether leadership is under unsustainable pressure and how this impacts overall system performance.

A tool to help diagnose real pressures in real time.
After years of hands-on experience in leadership, diagnostics, and systems design, we founded Pulse by SHI to help organizations uncover hidden inefficiencies and unlock their true operational potential. Through our dynamic reporting tools and intuitive visual insights, we bring clarity, confidence, and action to the heart of your system.
WHY SYSTEMS FAIL AND HOW SHI RESTORES HEALTH
Why systems fail
Hidden inefficiencies drain resources.
Data stays siloed or ignored.
Leaders react too late to early warning signs.
Unprepared systems buckle under external pressures.
How SHI restores health
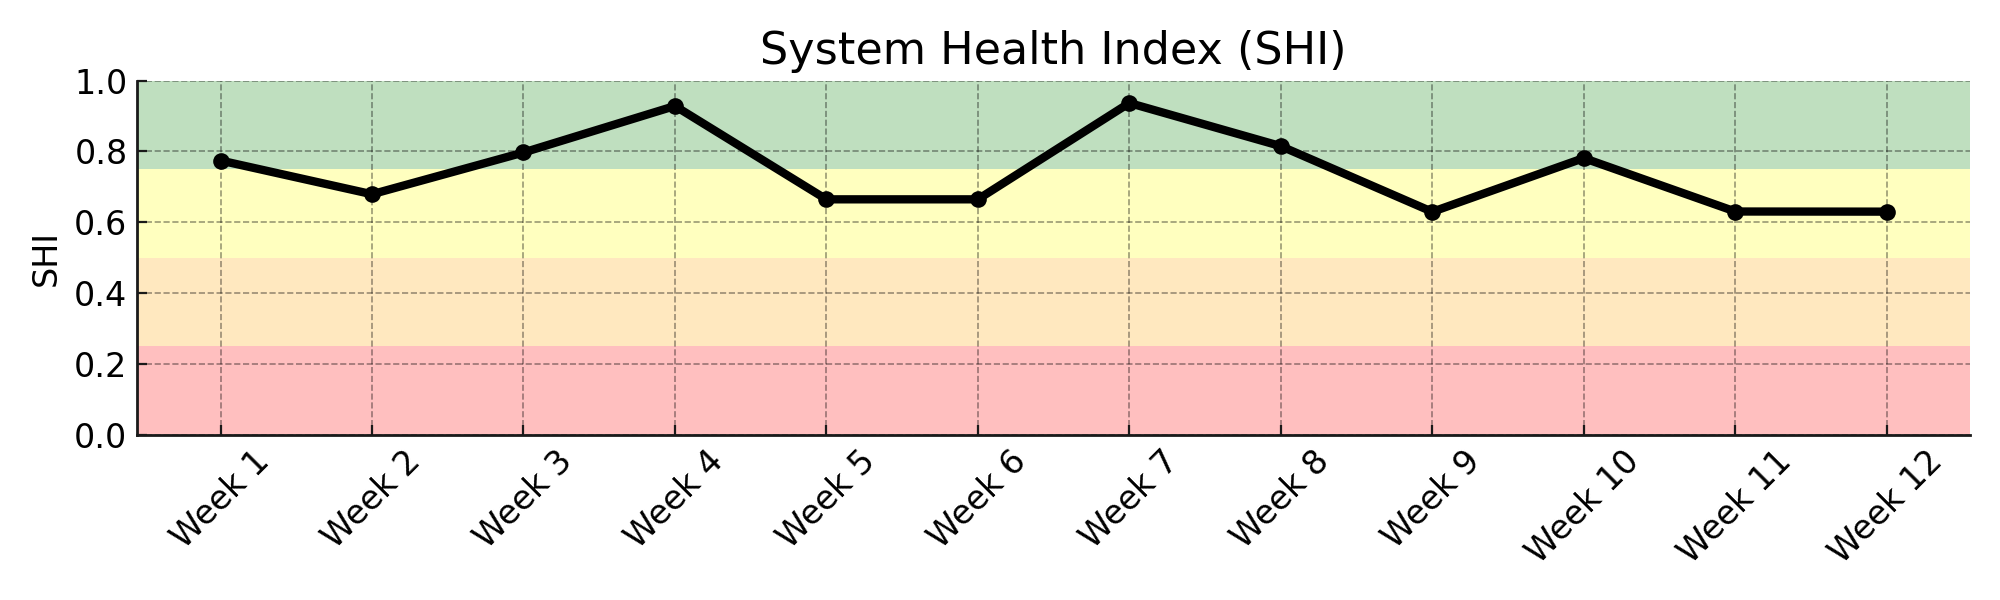
Converts raw inputs into a clear SHI score and pulse graph.
Flags stress before it becomes collapse.
Ties every recommendation to measurable variables.
Guides systems toward stability, resilience, and growth.
Your system is talking. This is how we listen.
The Pulse by SHI dashboard can compresses thousands of operational data points into a single, readable moment. Each color shift marks a change in system health — green for stability, yellow for warning, orange for strain, and red for critical decline. Together, these indicators tell the real story behind performance, risk, and resilience.
How SHI Is Different
Most tools measure fragments. They track KPIs, count incidents, or log budget lines - but they don’t show how the pieces interact, or what happens next.
SHI measures systems.
Fractal lens: Whether it’s a business, a species, or a city, SHI applies the same universal framework - inputs, throughput, outputs, and resilience.
Pulse graph: A living heartbeat that shows not just where you are, but whether health is trending up or down.
Action plans: Every recommendation targets the weakest variable first, making regression impossible - each move is a non-regret action.
Predictive edge: By tracking change over time, SHI doesn’t just describe the system - it signals collapse windows and recovery paths.
SHI isn’t just analytics. It’s a doctor’s visit for your system.
Works With the Data You Already Track
Most organizations already measure budgets, KPIs, or operational metrics - but they sit in silos. SHI doesn’t replace those numbers, it connects them. By aligning BI data with system variables, SHI turns scattered metrics into a single heartbeat pulse. What once looked like noise now reveals a clear rhythm of health, risk, and resilience.
Doing What No One Else Has Done
Most tools stop at numbers. They track production, budgets, or KPIs, but they miss the most critical factor: how leadership time is actually spent.
SHI introduces Command Load.
Through short, structured questionnaires, leaders can quantify how much of their workday is spent within their true scope versus outside it. Every minute spent covering out-of-scope tasks - from firefighting unplanned issues to filling operational gaps - adds invisible strain to leadership capacity.
By capturing this balance, SHI reveals when leaders are truly steering the system, and when they’re forced to wear multiple hats. This turns leadership strain into measurable data, giving organizations a way to see how role misalignment impacts system health.
For the first time, you get a system report that shows not only the hard numbers, but also the hidden drag of scope creep on your leadership team.
Capturing External Factors
Pulse and Compass don’t stop at internal metrics — they actively incorporate external pressures into system health reports. From market shifts and environmental stressors to regulatory changes or supply chain volatility, these outside forces are integrated into the pulse. This means you’re not only measuring system health from the inside out, but also mapping the external pressure points that can trigger systemic failure.
“We can’t impose our will on a system. We can listen to what the system tells us, and discover how its properties and our values can work together to bring forth something much better than could ever be produced by our will alone.”