
Turn Pressure Into Performance
SHI diagnoses system stress, predicts risk, and delivers action plans that improve efficiency, profitability, and resilience.
Every KPI tells a story. Pulse by SHI helps you see the whole story.
Most organizations track dozens of key performance indicators across departments, projects, and operations. Each KPI provides valuable insight, but when viewed in isolation, important relationships can be missed.
Pulse by SHI brings your existing data together into a single system health framework, revealing how the relationships between your KPIs influence overall performance.
By analyzing the interaction between inputs, structures, and outcomes, Pulse helps identify hidden pressures, emerging risks, and opportunities for improvement before they become costly problems.
Using the data you already collect, Pulse can help you:
Reduce margin attrition
Improve operational awareness
Identify emerging risks earlier
Strengthen decision-making
Build a more resilient foundation for growth
Your KPIs already tell a story. Pulse helps you understand the plot.
What the System Health Index Is and What It Measures
The System Health Index (SHI) is a diagnostic framework that consolidates the raw data organizations already collect - through KPIs, BI systems, and other reporting methods - into a single, holistic view of system health.
Unlike traditional metrics, SHI is designed to be scalable: it can measure the health of a crew, a division, or an entire company. A unique feature of SHI is its ability to measure Command Load - a variable that indicates whether leadership is under unsustainable pressure and how this impacts overall system performance.

A tool to help diagnose real pressures in real time.
After years of hands-on experience in leadership, diagnostics, and systems design, we founded Pulse by SHI to help organizations uncover hidden inefficiencies and unlock their true operational potential. Through our dynamic reporting tools and intuitive visual insights, we bring clarity, confidence, and action to the heart of your system.
WHY SYSTEMS FAIL AND HOW SHI RESTORES HEALTH
Why systems fail
Hidden inefficiencies drain resources.
Data stays siloed or ignored.
Leaders react too late to early warning signs.
Unprepared systems buckle under external pressures.
How SHI restores health
Converts raw inputs into a clear SHI score and pulse graph.
Flags stress before it becomes collapse.
Ties every recommendation to measurable variables.
Guides systems toward stability, resilience, and growth.
Your system is talking. This is how we listen.
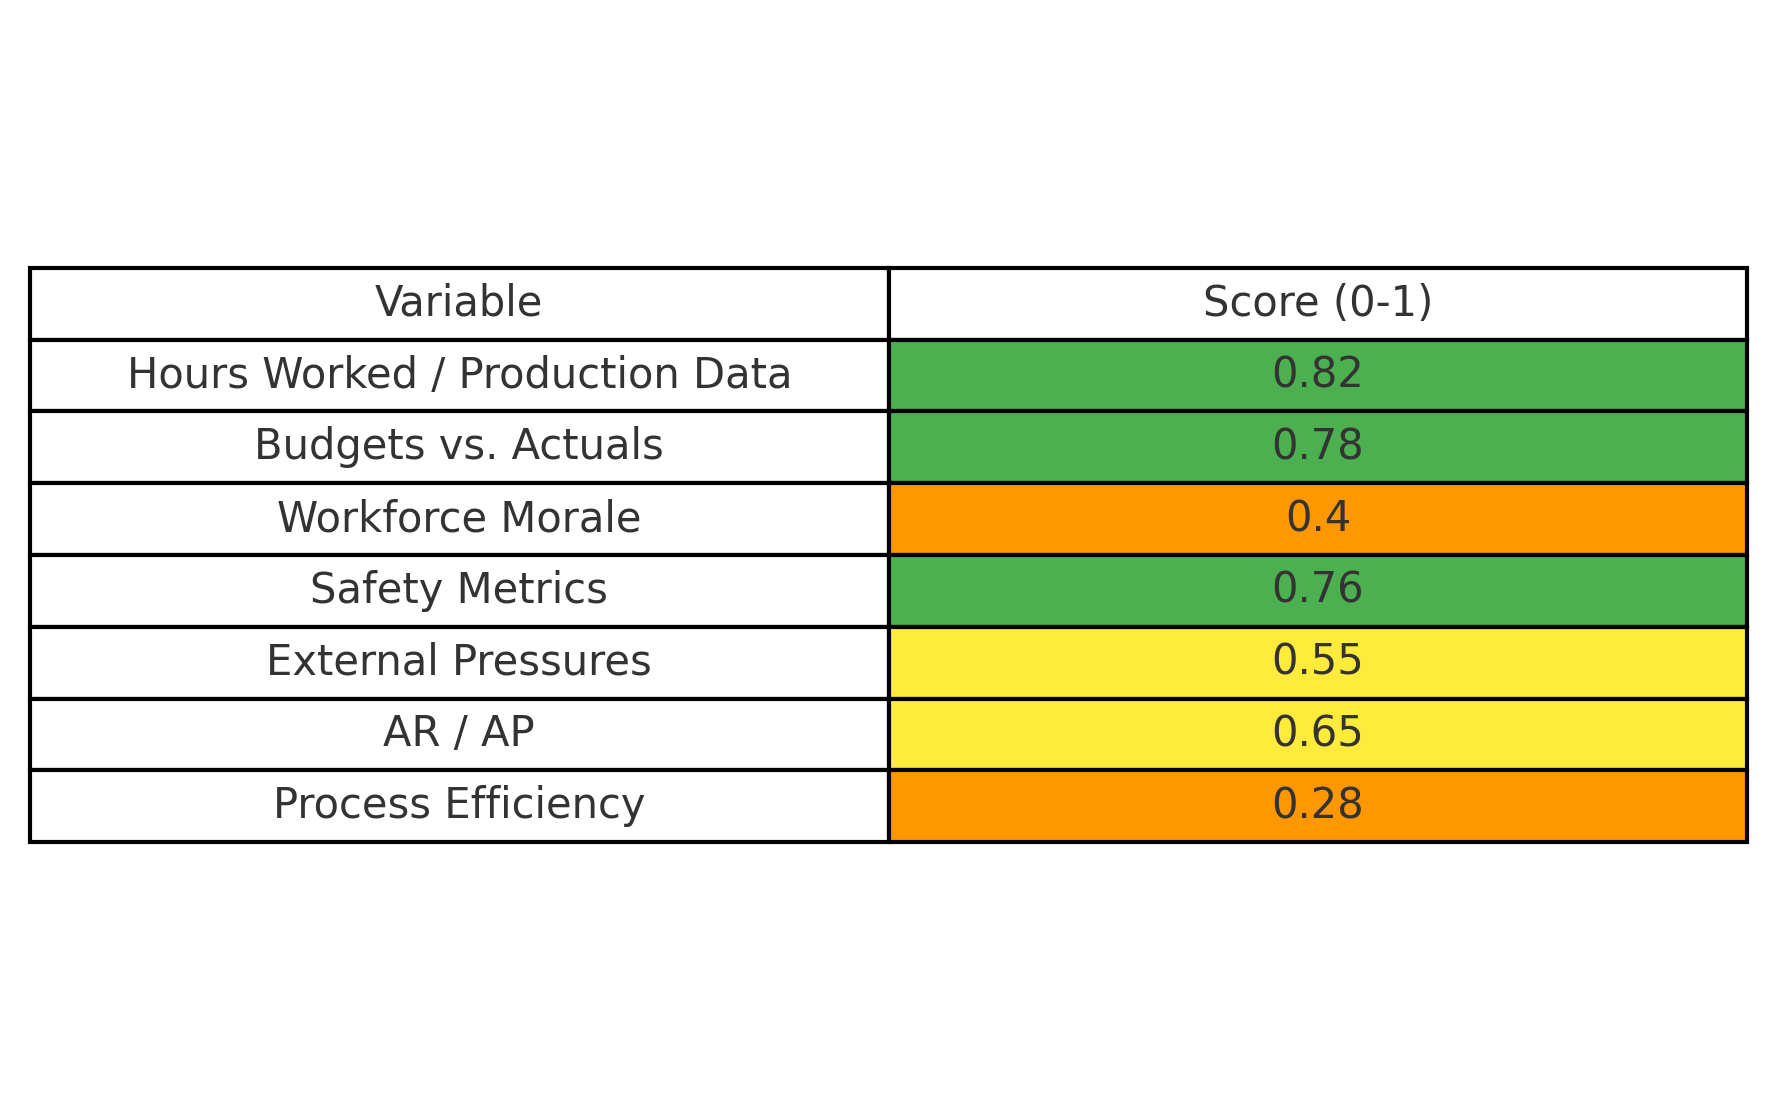
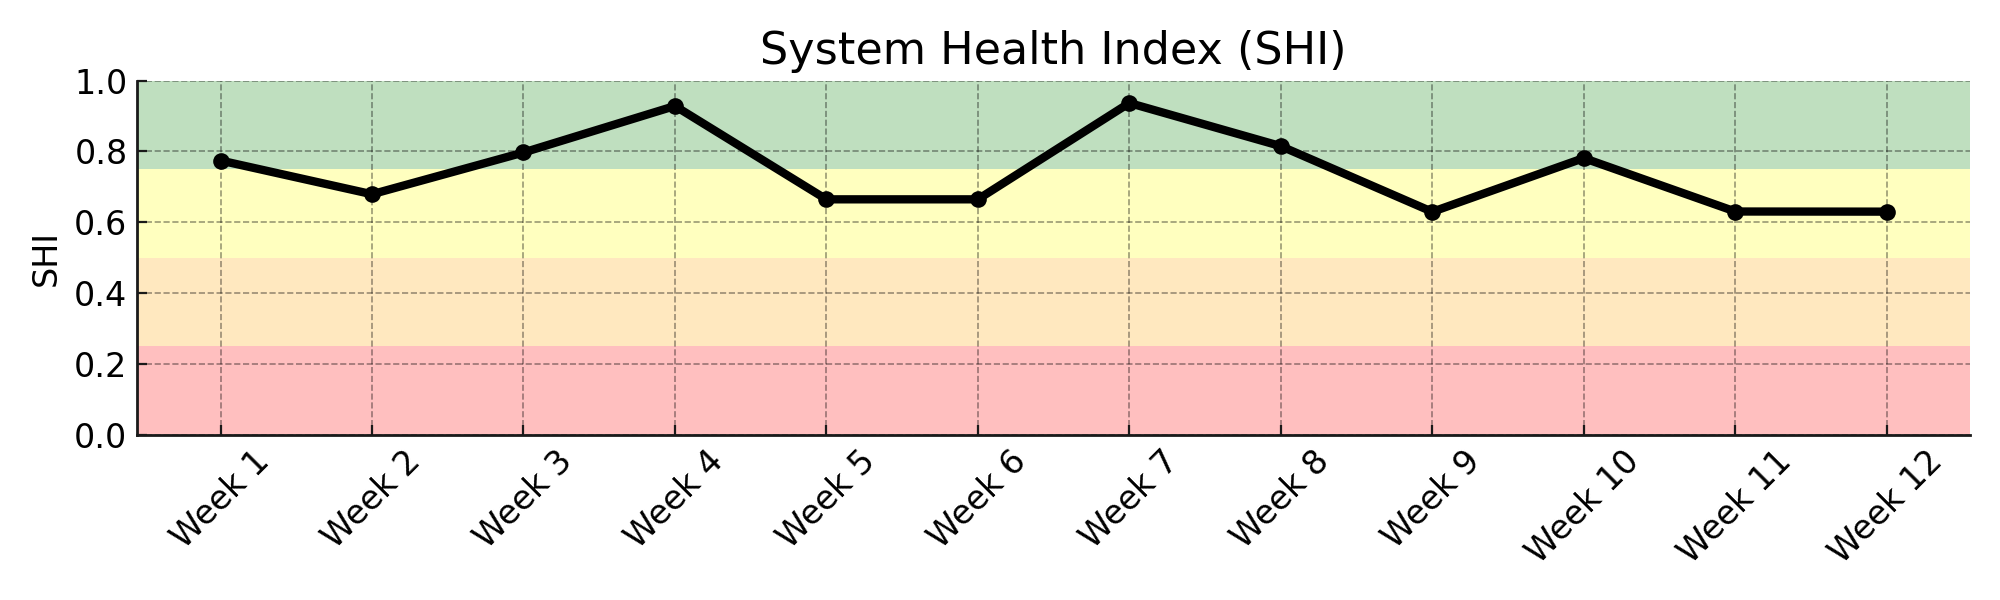
The Pulse by SHI dashboard can compresses thousands of operational data points into a single, readable moment. Each color shift marks a change in system health — green for stability, yellow for warning, orange for strain, and red for critical decline. Together, these indicators tell the real story behind performance, risk, and resilience.
How SHI Is Different
Most tools give you numbers.
SHI gives you clarity, priorities, and actionable insight.
One Unified View of Your Business Health
Instead of scattered KPIs and siloed reports, SHI turns everything you already track into one simple pulse.
You instantly see:
What’s healthy
What’s unstable
What’s costing you money
What needs attention first
No digging. No guessing. Just clarity.
Shows You Problems Before They Become Expensive
SHI measures change over time, so you don’t just see where things are you see where they’re heading.
It highlights early warning signs like:
Bottlenecks forming
Budget bleed
Declining productivity
Risk accumulating in one area
You get time to act before the system slips.
Action Plans That Actually Move the Needle
Every recommendation is based on the weakest variable. This is the spot where one improvement produces the biggest impact.
This means:
No wasted effort
No chasing the wrong issues
No fixing symptoms instead of causes
You always know the next right move.
Reveals the Hidden Load on Your Leadership Team
Most tools ignore leadership strain. This is one of the biggest predictors of failure.
SHI measures:
How much firefighting leaders are forced into
Where scope creep is draining capacity
When managers are overloaded and can’t steer
How this affects system stability
This gives you a clear picture of why things break down and how to fix it.
Includes External Pressures, Not Just Internal Data
Your business doesn’t operate in a vacuum.
SHI integrates outside factors like:
Market conditions
Supply chain volatility
Weather or seasonal shifts
Regulatory changes
Industry stressors
You get a realistic view of your system under actual conditions. Not ideal ones.
In Short: SHI Gives You What KPIs Can’t
KPIs tell you what happened.
SHI tells you:
Why it happened
What it means for system health
What will happen next if nothing changes
Exactly what to do to improve it
That’s the value.
“We can’t impose our will on a system. We can listen to what the system tells us, and discover how its properties and our values can work together to bring forth something much better than could ever be produced by our will alone.”